Remote Time Evaluator way to large

Hi there, I tried to benchmark multiple deep learning compilers on the raspberry pi 4. For most of them I compiled them into standalone bundles. But I was unable to achieve this with TVM after Auto-Tuning or Quantization (do not know why).

But I was told, that I should use the remote runtime module time_evaluator function. Problem is: The output is 10x higher than what has been measured previously.

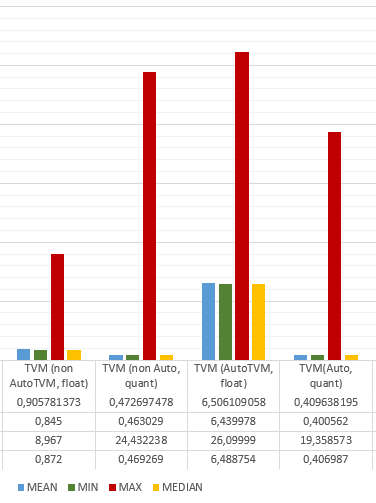
In the standalones only the raw inference time has been measured and from the documentation of TVM it looks like, that should be the case for the runtime as well. But I get 6ms instead 0.8ms per inference.

I found the Issue on GitHub, which seems to address wrong time_evaluator outputs, but ARM CPUs should be fixed and the problem was to small outputs. (https://github.com/apache/incubator-tvm/issues/5215)

Why is the result so different? And is there a way to deploy to standalone without the runtime? (see AutoTVM or Quantization for Raspberry Pi fails)

Not understand fully about 6ms vs 0.8ms. Could you explain a bit more clear and paste the time log (like auto tuning time log / per layer time log ( you could turn on debug graph time and use it to get) )?

The 0.8ms have been achieved using an non auto-tuned floating point version of my network inside a TVM standalone (see Bundle Deploy - Github).

As I was unable to use the same approach with a quantized or auto-tuned version of the network (see Other Issue regarding this problem), I got the recommendation to use the RPC-API to do my benchmarking (GitHub Issue).

I tried the RPC time_evaluator function and got 6ms for the same network.

(I will add the time logs as soon as I can)

{"input": ["llvm -device=arm_cpu -target=arm-linux-gnu", "conv2d_NCHWc.x86", [["TENSOR", [1, 1, 28, 28], "float32"], ["TENSOR", [8, 1, 5, 5], "float32"], [1, 1], [2, 2, 2, 2], [1, 1], "NCHW", "NCHW", "float32"], {}], "config": {"index": 0, "code_hash": null, "entity": [["tile_ic", "sp", [-1, 1]], ["tile_oc", "sp", [-1, 1]], ["tile_ow", "sp", [-1, 1]], ["unroll_kw", "ot", true]]}, "result": [[0.0015573943999999998], 0, 3.8097798824310303, 1595230936.2957578], "version": 0.2, "tvm_version": "0.7.dev1"}
{"input": ["llvm -device=arm_cpu -target=arm-linux-gnu", "conv2d_nchw_spatial_pack.arm_cpu", [["TENSOR", [1, 1, 28, 28], "float32"], ["TENSOR", [8, 1, 5, 5], "float32"], [1, 1], [2, 2, 2, 2], [1, 1], "float32"], {}], "config": {"index": 2445, "code_hash": null, "entity": [["tile_co", "sp", [-1, 2]], ["tile_oh", "sp", [-1, 28]], ["tile_ow", "sp", [-1, 28]], ["reorder_0", "re", [0, 1, 2, 3, 4, 5, 6, 7, 8, 9]], ["ann_reduce", "an", ["none", "none"]], ["ann_spatial", "an", ["none", "none", "vec"]]]}, "result": [[0.0028908516], 0, 3.4126908779144287, 1595231548.4120507], "version": 0.2, "tvm_version": "0.7.dev1"}
{"input": ["llvm -device=arm_cpu -target=arm-linux-gnu", "conv2d_NCHWc.x86", [["TENSOR", [1, 8, 14, 14], "float32"], ["TENSOR", [16, 8, 5, 5], "float32"], [1, 1], [2, 2, 2, 2], [1, 1], "NCHW", "NCHW", "float32"], {}], "config": {"index": 185, "code_hash": null, "entity": [["tile_ic", "sp", [-1, 2]], ["tile_oc", "sp", [-1, 2]], ["tile_ow", "sp", [-1, 7]], ["unroll_kw", "ot", false]]}, "result": [[0.0033298216], 0, 0.5387725830078125, 1595232164.824161], "version": 0.2, "tvm_version": "0.7.dev1"}
{"input": ["llvm -device=arm_cpu -target=arm-linux-gnu", "conv2d_nchw_spatial_pack.arm_cpu", [["TENSOR", [1, 8, 14, 14], "float32"], ["TENSOR", [16, 8, 5, 5], "float32"], [1, 1], [2, 2, 2, 2], [1, 1], "float32"], {}], "config": {"index": 631, "code_hash": null, "entity": [["tile_co", "sp", [-1, 2]], ["tile_oh", "sp", [-1, 7]], ["tile_ow", "sp", [-1, 14]], ["reorder_0", "re", [0, 1, 2, 3, 4, 5, 6, 9, 7, 8]], ["ann_reduce", "an", ["unroll", "unroll"]], ["ann_spatial", "an", ["none", "none", "none"]]]}, "result": [[0.0031675936], 0, 12.180986404418945, 1594992948.6131058], "version": 0.2, "tvm_version": "0.7.dev1"}

Here is the missing log file for basic AutoTVM

According to your tuning log, the timing is not measured wrongly. You could see the result column: result": [[0.0015573943999999998], which says we will execute 1.5ms. The network you compared with is the same? I mean we couldn’t compare floating point network v.s. quantized network performance. Another question is how to get 0.8ms?

1 Like

ok, thank you. Now I understand the output a bit better, but why does it say 1.5ms here and the time_evaluator returns 6ms?

I got the 0.8ms by checking system time before and after execution of one inference. The C function should be called getdatetime (or something similar). I can attach the C code as well, if you want to see it.

ok, my test run with quantization&AutoTVM and quantization without auto-tuning just finished, an it gets even more stranger:

  • float, AutoTVM, time_evaluator = 6ms

  • float, bundle, C time measure = 0.8ms

  • quant, AutoTVM, time_evalu = 0.41ms

  • quant, non AutoTVM, time_eval = 0.47ms

  • float, none AutoTVM, time_eval = still evaluating (a couple of minutes now for 100,000 runs, quant took ~60 seconds)

It is obvious, that I have made a mistake, but I am not sure where…

(time in ms, leftmost results are measured in the C bundle)

1.5ms is this layer’s performance : [1, 1, 28, 28], "float32"], ["TENSOR", [8, 1, 5, 5], "float32"],. And we must know this is not the whole network’s performance. Besides this, we maybe have layout transform / other ops

1 Like

I am curious C bundle way how to measure.

I am using the gettimeofday function, provided by <sys/time.h>

gettimeofday(&t_start, 0);

tvm_runtime_run(handle);

gettimeofday(&t_end, 0);

I am still confused about my AutoTVM results, in the post above…

Maybe you have calculated wrong time duration? for example, it is 8ms, not 0.8ms?

well, I do it the same way as the example, but only with the inference.

the calculation is

(t_end.tv_sec - t_start.tv_sec) * 1000 + (t_end.tv_usec - t_start.tv_usec) / 1000.f

And the result fits very well into the results of other compilers, which I have tested