[RFC] Visualizing Relay program as graph

Currently, the only way to inspect the Relay program is through the text format:

v0.0.4
fn (%x: Tensor[(21), float32], %y: Tensor[(958, 21), float32]) {
  %0 = subtract(%x, %y);
  %1 = multiply(%1, %1);
  sum(%1, axis=[1])
}

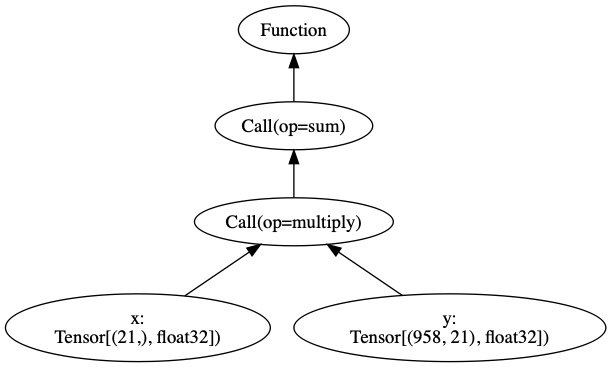
It would be nice if we can visualize the Relay program as a graph like this: gv

I wrote a rudimentary script to generate GraphViz diagram from a Relay function, but it would be useful if visualization functionality became part of the TVM codebase.

My proposal is to add a function tvm.relay.analysis.visualize() under the tvm.relay.analysis namespace. The function should accept a Relay Function object as the input and produce one of the following:

  • GraphViz Dot program (Dot is a language used in GraphViz)
  • JSON dump, to be ingested by other packages such as Netron. This way, Netron won’t require TVM itself to parse a Relay program.

If this sounds reasonable to the community, I will prepare a pull request.

@haichen @junrushao @yzhliu

14 Likes

Hey Phil, just saw your nice visualization last week. Love it :+1:

BTW, do you have any plan for supporting if-then-else?

@junrushao Yes, the PR will support if-then-else. The if-then-else node will need to take three child nodes: the condition, the true branch, and the false branch.

1 Like

+1. I take that back. +1000. Inspectability of the compilation process, including visualization of the IRs, is super important and this is a great step in that direction.

Graphviz is great because it is widely available, many people know it and it produces an image file that it is trivial to open on any machine from a link, though also Graphviz is not so great at very large graphs. One way to handle that is to have an option to display a radius around a node (as in slides below) or to have the option to use a different library as well in case of large graphs, e.g. TensorBoard. I don’t know if Netron is good for large graphs, maybe it is? No need for us to address any of that initially, having this is a great advance, though it would be good if the API is written in a way so that it is natural to add more things later.

(There are some style details that can be worked out later/over time, e.g. it would be nice if every op would say what shape/type it produces, rectangular nodes are more economical of space, multiple operands implies a need to distinguish incoming edges and color coding of ops can be useful for larger examples. Slide 13-15 might offer some inspiration: https://drive.google.com/file/d/1AfNoznbCIejQLErblXF7CV_Wk4cJypuC/view Though this is great as-is!)

4 Likes

Thanks Philip. This will increase productivity and debugging capabilities multi-fold.

Moving down the line, I think we might want to think how to represent multi-subgraphs (will happen in a fused graph and graph partitioning) and control flow constructs etc. For now, it might be ok to keep things simple.

@broune I appreciate your comments. The slides is certainly a good inspiration. I’ll keep fiddling with GraphViz to get better looking graphs.

to have the option to use a different library as well in case of large graphs, e.g. TensorBoard

Yes, I was also worried about using large graphs in GraphViz, so I put the JSON dump option. @haichen suggested Netron, and it is a JavaScript library. I’ll see how it handles a ResNet model.

TensorBoard option will definitely be useful, since TensorBoard lets you collapse and expand parts of the graph interactively. The disadvantage is that TensorBoard uses Protobuf for serializing deep learning graphs, and Protobuf is rather a heavy dependency in my experience.

We can certainly engineer the API so that dependencies like graphviz or protobuf is lazily imported upon calling tvm.relay.analysis.visualize()

Yes, it would be nice to be able to visualize the effect of each individual Relay pass, such as operator fusion. I have an occasion where I have to write a custom Relay pass, and this capability will ensure that I didn’t mess up.

Great proposal, I think it is important to separate the concerns of data representation and rendering:

  • Defining a structured specification of the visualization spec(e.g. JSON) that can be translated and ingested to other visualizers(Netron, GraphViz)
  • Document that structure specification
  • Work on exporter
  • Work on the visualization (or perhaps not depending on how powerful the viz grammar is)

It would also be great to get some feedbacks from data-viz community about what specific things could be in the spec.

This idea of separation of data and rendering follows the same philosophy in visualization packages like https://vega.github.io/vega-lite/ (except these are for tabular style data)

1 Like

@tqchen I like the idea of separating data representation and rendering. Let me draft a spec for data representation soon.

1 Like

Per @tqchen’s suggestion, we should have Relay produce a JSON-like data representation that can be ingested by multiple visualizers (GraphViz, Netron, TensorBoard). I’ll refer to this data representation RelayViz. In this document, we write RelayViz objects as JSON objects.

Specification for RelayViz data representation

Root object layout

{
  "format": "relayviz",
  "version": [1, 0],
  "nodes": [ <list of nodes> ]
}

General principles

  • Many nodes in Relay (Call, TupleGetItem, Function etc) have references to other nodes. Such references should be encoded as an integer ID. The integer ID locates the referenced node in the “nodes” field of the root object. For example, a Function node has a body attribute that refers to another Relay node. So the Function node should store the node ID of the function body.
  • All attributes of Relay nodes that are not node references should be encoded as an attribute.

Example: Function node (one node reference, one attribute)

{
  "node_kind": "Function",
  "body": <node ID of function body>,
  "ret_type": {
    "dtype": "float32",
    "shape": [64]
  }
}

Example: Call node (five node references, two attributes)

{
  "node_kind": "Call",
  "op": "nn.batch_norm",
  "args": [
    <node ID of first argument>,
    <node ID of second argument>,
    <node ID of third argument>,
    <node ID of fourth argument>,
    <node ID of fifth argument>,
  ]
}

Spec for particular nodes

This spec should cover all Relay nodes in https://docs.tvm.ai/api/python/relay/expr.html. All appearances of bracketed phrases (<...>) should be interpreted as placeholders.

Function node

{
  "node_kind": "Function",
  "body": <function body (node ID, integer)>,
  "params": [
    <Input variable (node ID, integer)>,
    ...
  ],
  "ret_type": {
    "dtype": <type of tensor element (string)>,
    "shape": <shape (dimension) of tensor (list of integers)>
  }
}

Note: each element in the “params” field must refer to a Variable (Var) node.

Var (variable) node

{
  "node_kind": "Var",
  "name": <name of variable (string)>,
  "dtype": <type of tensor element (string)>,
  "shape": <shape (dimension) of tensor (list of integers)>
}

Note: we set the “shape” field to an empty list ([]) for scalars.

Call node

{
  "node_kind": "Call",
  "op": <name of operator to call (node ID, integer)>,
  "args": [
    <call argument (node ID, integer)>,
    ...
  ]
}

The value for the “op” field shall correspond to an Operator node.

For now, we skip attrs argument in tvm.relay.expr.Call.

Operator (op) node

{
  "node_kind": "Op",
  "name": <name of operator (string)>,
  "attrs": <attributes for the operator (dict)>
}

The “attrs” should store the attributes specific to the operator. For example, the convolution operator (conv2d) should store padding and strides as attributes. For the sake of simplicity, I will skip the “attrs” field for my upcoming pull request.

Const (constant) node

{
  "node_kind": "Const",
  "value": <value of the constant (int, float, or dict)>,
  "dtype": <type of tensor element (string)>
}

Note: if the constant is a tensor, then the “value” field will be set to the object

{
  "array_value": <array value (list of floats)>,
  "array_shape": <shape of the tensor (list of integers)>
}

Bind node

{
  "node_kind": "Bind",
  "expr": <the input expression (node ID, integer)>,
  "binds": {
    <variable_name> : <expression to bind (node ID, integer)>,
    ...
  }
}

Note: In tvm.relay.expr.bind, the binds argument may be one of the two types:

  • Map[tvm.relay.Var, tvm.relay.Expr]
  • Map[str, tvm.relay.Expr]

If binds is of type Map[tvm.relay.Var, tvm.relay.Expr], then set the <variable_name> placeholder to a value of form “node_XXX”, where XXX is the node ID of the Variable node.

Tuple node

{
  "node_kind": "Tuple",
  "fields": [
    <tuple element (node ID, integer)>,
    ...
  ]
}

Let node

{
  "node_kind": "Let",
  "variable": <local variable to be bound (node ID, integer)>,
  "value": <value to be bound (node ID, integer)>,
  "body": <body of the let binding (node ID, integer)>
}

If node

{
  "node_kind": "If",
  "cond": <condition to test (node ID, integer)>,
  "true_branch": <expression evaluated when condition is true (node ID, integer)>,
  "false_branch": <expression evaluated when condition is false (node ID, integer)>,
}

TupleGetItem node

{
  "node_kind": "TupleGetItem",
  "tuple_value": <input tuple (node ID, integer)>,
  "index": <index of element to be extracted (integer)>
}
The spec I proposed captures all information that can be obtained from the Python interface to Relay. We can discuss further additions to the spec in a later work. (For example, I left out all operator-specific attributes.) The spec adopts a JSON-like format so that it’s easy to add new attributes.

Prototype implementation is now put up as a draft pull request: https://github.com/apache/incubator-tvm/pull/4370

3 Likes

Hi guys: I noticed the pull request failed. Do you still plan to add this function? I thin it is very useful.

Best

I had other priorities. I will get back to it by end of this year.

Thanks for the great proposal. @hcho3, I followed your script in github and noticed it missed a case when operator being "Call"ed is a function.

Adding some code within “Call” condition can generate graph with each function singled out.

            elif isinstance(node, tvm.relay.expr.Call):
                args = [node_dict[arg] for arg in node.args]
                if isinstance(node.op, tvm.relay.Function):
                    print(f'node_idx: {node_idx}, Call(Function({node_dict[node.op.body]}))')
                    dot.node(str(node_idx), f'Call(Function({node_dict[node.op.body]}))')
                else:
                    print(f'node_idx: {node_idx}, Call(op_name={node.op.name}, args={args})')
                    dot.node(str(node_idx), f'Call(op={node.op.name})')
                for arg in args:
                    dot.edge(str(arg), str(node_idx))
            elif isinstance(node, tvm.relay.Function):
                print(f'node_idx: {node_idx}, Function(body={node_dict[node.body]})')
                dot.node(str(node_idx), f'Function'+str({node_dict[node.body]}))
                dot.edge(str(node_dict[node.body]), str(node_idx))

1 Like

I’m a bit hesitant to comment here, but it looks like the PR from this discussion is stalled. I wonder if part of that is that the RelayViz abstraction is too ambitious at this point.

I got to this question after I have been looking at adapting the visualization from the starting from the PR and after the first three changes, I moved to merging the two steps again, because I felt like I was writing everything twice.

  • RelayViz came about as a way to separate data representation and rendering. However, as far we are relay-specific, I cannot help but feel that the relay graph already is already a representation, just not a serialization format.
  • Now, having a json-based serialization format is nice and I can see how a visualizer would make use of that if it were available. However, I also feel that developing both at the same time is only worth if one reduces the total number of converters needed.
  • If we have a serialization format covering N frameworks instead of “just relay” and M visualizers, we would have N * M potential conversions and a common intermediate would reduce the converters needed from N * M to N + M. Clearly that would be worth having.
  • If we just have relay, so N = 1, we need 1 + M and for the first visualizer it is 1 + 1, “twice the work” of writing just the visualizer.
  • My experience (from writing visualizers for both sides of the the PyTorch frontend) seems to be that they are different enough (or the features I was looking for were different enough) that an intermediate representation covering both to a large degree (rather than bing the equivalent of just running through the PyTorch frontend and then visualizing the resulting relay) increases the effort significantly and introduces all sorts of things we don’t really need for relay visualizations.

So while I think that RelayViz is a neat idea, it would seem that most people interested in visualization want it for the other things they’re working on, and perhaps the RelayViz design is making it too large a project for people with other priorities.

Again, I don’t want to keep anyone from working on a more proper solution but rather highlight some cost-benefit considerations I met when looking at this. I just wanted to share some observation of what happened when I started to look into whether I could revive the PR and then found that it would be too large for me. I’ve been wondering if maybe having visualization directly from the relay graph objects is worth having until we have some more experience of what we look for when visualizing the graph.

Best regards

Thomas

3 Likes

One use case I have for a visualizer is to visualize the partitioning output in BYOC flow. Right now I’d check the output by eye-balling the text rep, but I wish there could be easier way than that.

It would be great if I could visualize the entire graph, with partitioned functions color coded differently, so that verifying the partitioning result is more straightforward.

I’m currently working with a signature of visualize(expr, collapse_small=True, node_attr_dict = {}) where node_attr_dict is Expr->Dict[str, str] with kwargs for node. (And yeah, I know about the lint-complaint regarding mutuable objects as default values.)

How does this RFC go at this point?

From an accelerator vendor compiler perspective, if he choose relay as the frontend IR, visualizing it must be necessary.

Even the function might not be perfect (e.g., it only can show data-flow graph), it will still be extremed wanted!

Hi,

I know this RFC is a little old, but we really want a Relay visualization tool. So we try to implement one based on

  1. pull request 4370
  2. Bridging PyTorch and TVM

and want to know if anyone is still interested in this topic.

The draft PR is: [Draft PR] Relay IR visualizer. by chiwwang · Pull Request #8448 · apache/tvm · GitHub

At this point, we have similar feelings as @t-vi . It seems to be too ambitious to do a Relay visualization library as a start.

Instead of explicitly defining a separate data representation, we define an interface Plotter. We start with a specific plotting backend (Bokeh, due to its interactive capability.)

If json or anything else such as classic graphviz are needed, we could just implement the Plotter interface to render them out. (I believe the graphviz case will be very similar to what has been done in bert-pytorch-tvm)

We try to keep everything simple because in our cases, what we need is quick look-then-fix. The appearance of the graph heavily rely on the default of the chosen plotting library.

Example output and README links are in the draft PR.

Any feedback is welcome.

Thank you :slight_smile:

3 Likes