[VTA] Issue with TSIM based simulation of resnet18 inference on VTA

Hi @liangfu,

The simulation output here is:

tvm/vta/tutorials/frontend > python deploy_vision_on_vta.py resnet18_v1 inference graph built in 57.55s! File synset.txt exists, skip.

Execution statistics: cycle_count : 29953046

resnet18_v1 prediction for sample 0 #1: punching bag, punch bag, punching ball, punchball #2: chain mail, ring mail, mail, chain armor, chain armour, ring armor, ring armour #3: panpipe, pandean pipe, syrinx #4: grocery store, grocery, food market, market #5: mailbag, postbag Traceback (most recent call last):

File “deploy_vision_on_vta.py”, line 287, in assert(cat_detected)

AssertionError

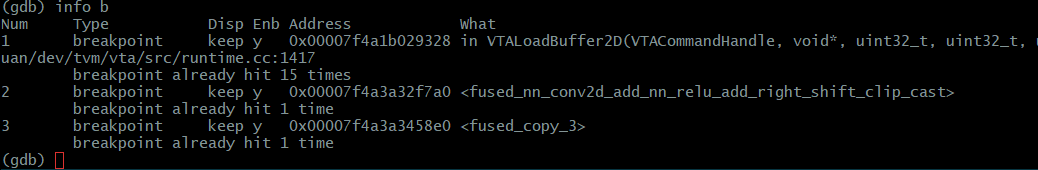
Could you kindly let me know the steps to debug this issue?

Best regards.

Kevin

Here is a list of functions that should be called by the runtime.

3 fused_nn_conv2d_add_nn_relu
4 fused_nn_max_pool2d
5 fused_reshape_transpose
6 fused_multiply_round_clip_cast
9 fused_nn_conv2d_add_nn_relu_add_right_shift_clip_cast
10 fused_copy_3
13 fused_nn_conv2d_add_add_right_shift_clip_cast_3
14 fused_copy_3
...

Can you print the first few digits in the output of the layer fused_nn_conv2d_add_nn_relu_add_right_shift_clip_cast ? It’s a bit hack, but you can fetch the buffer when the 1st fused_copy_3 layer is calling VTALoadBuffer2D. Here is a few lines I added to the VTALoadBuffer2D function for debugging.

int elem_bytes = static_cast<vta::CommandQueue*>(cmd)->GetElemBytes(dst_memory_type);
vta::DataBuffer* src = vta::DataBuffer::FromHandle(src_dram_addr);                   
char * addr = ((char*)src->virt_addr()) + src_elem_offset * elem_bytes;              

fprintf(stderr, "[%d, %d, %d, %d, %d, %d, %d, %d, ...], 0x%lx, ",                                     
        addr[0], addr[1], addr[2], addr[3], addr[4], addr[5], addr[6], addr[7], ((uint64_t*)addr)[0]);

Hope this helps.

Another workaround is to enable tracing in TSIM and terminate after first VTASynchronize call, so that we can look into the signal changes in the VCD file. The output of the layer should be shown when the Store module write output to VME.

I think this would be helpful to debug end-to-end inference with TSIM backend.

Hi @liangfu,

Here are the output from the simulation by following your debug method:

 [5, 8, 3, 0, 0, 6, 4, 0, ...], 0x4060000030805,
 [-2, -5, 2, -1, -2, -1, 2, -1, ...], 0xff02fffeff02fbfe,
 [5, 8, 3, 0, 0, 6, 4, 0, ...], 0x4060000030805,
 [-2, -3, 5, -1, 4, -2, -4, 4, ...], 0x4fcfe04ff05fdfe,
 [7, 10, 0, 17, 9, 0, 0, 0, ...], 0x911000a07,
 [0, 0, 1, -1, 0, 3, 1, 4, ...], 0x4010300ff010000,
 [7, 10, 0, 17, 9, 0, 0, 0, ...], 0x911000a07,
 [6, 0, 1, 1, -6, 4, -5, -5, ...], 0xfbfb04fa01010006,
 [0, 9, 3, 2, 2, 5, 0, 0, ...], 0x50202030900,
 [0, 1, -2, -2, 2, 0, 2, 1, ...], 0x1020002fefe0100,
 [0, 9, 3, 2, 2, 5, 0, 0, ...], 0x50202030900,
 [4, 0, 2, 2, -2, -6, -3, -4, ...], 0xfcfdfafe02020004,

FYI, I also attached the screenshot of “info br” from gdb which confirms it’s the firsttime hit the VTALoadBuffer2D in fused_copy_3 .

Please advise me what the next step .

Very appreciate for your help :slight_smile:

Best regards.

Kevin

@kevinyuan It’s nice to hear you have captured the buffers. You have exactly the same output as I do.

As the schedule for the computation are exactly the same for both TSIM and FSIM, you can compare the buffers layer by layer to find out the root cause of the wrong results.

Hope this helps.

Hi @liangfu,

The first difference between fsim & tsim happens at the 2237th VTALoadBuffer2D().

Could you kindly suggest a quick way to narrow down which node of the graph ops involkes the 2237th VTALoadBuffer2D().

Also, it looks the graphlib.o doesn’t include any debug symbols even with I use cmake -DCMAKE_BUILD_TYPE=Debug when I build the tvm runtime. Any way to enable the debug symbols for the graphlib.o ?

Best regards .

Kevin

For a simple trick to bring what function is being called by the runtime, add following line to GraphRuntime::Run

 void GraphRuntime::Run() {
   // setup the array and requirements.
   for (size_t i = 0; i < op_execs_.size(); ++i) {
+    fprintf(stderr, "fused_layer %d\n", (int)i);
     if (op_execs_[i]) op_execs_[i]();
   }
 }

In addition, you can get a list of functions in GraphRuntime::SetupOpExecs by applying

     std::tie(op_execs_[nid], op_args) =
         CreateTVMOp(inode.param, args, inode.inputs.size());
+    std::cerr << nid << " " << inode.param.func_name << std::endl;

     for (size_t i = 0; i < inode.inputs.size(); i++) {

It seems that running the module with

m.run()

is a hard requirement, and we should avoid running the module in time_evaluator for now.

Hi @liangfu,

Thanks for the fixes and the insights!

We met briefly at the TVM Conference last December and talked about Chisel VTA, DE10-Nano, etc. if you remember.

I wanted to report that I am also able to successfully run the deploy_vision_on_vta test case using ResNet18v1. Indeed it is now a Tubby Cat instead of a Beagle :smile:!

However, until your fix of Jan 18th in the LoadUop module this was not working. Even the unit tests for the ALU in vta/tests/python/unittest/test_vta_insn.py were failing, as well as the test_benchmark_topi_conv2d.py. So I’m not sure how it was working for you before.

Unit tests and other simple tests also work on the de10nano target (running at 100MHz :wink:!) , but unfortunately both test_benchmark_topi_conv2d and deploy_vision_on_vta still fail. I mean they complete with fail status. The deploy_vision returns a beagle …

Have you been able to run these tests on the de10nano?

I actually did quite a lot of work on the DE10-Nano that I would like to contribute.

In particular, I have introduced an fpga_mgr utility to program the de10nano from the host, so that now the de10nano target can be used just like the pynq.

I have also enhanced the qsys model adding a PLL enabling the FPGA build for frequencies other than the base 50MHz. I have successfully build images running at 80MHz and 100MHz (although the 100MHz build slow corner timing has a few setup violations but it works in practice, the fast corner is ok).

Then I have created an automated script that generates the DE10-Nano SD image from scratch with latest u-boot, linux kernel, and with an UBUNTU 18.04.3 server root fs so that building and configuring of the TVM target runtime is a breeze. The kernel is configured for CMA up to 512MB and includes the cma module you added sometime ago, which is also loaded at boot time.

I will create a PR as soon as I figure the procedure to open source the code.

Cheers, Pasquale

2 Likes

Hi @pasquale, thanks for reporting such great experimental results you have. I definitely remember the conversations with you at the conference.

We still need to extend the test coverage of Chisel VTA, in order to make everything work well on de10nano. To locate the error, I suggest comparing input/output buffers between TSIM backend and de10nano backend for now.

I think the FPGA program utility and the updated SD image are the great features to have, which extend the usability of the complete system. I would like to try your new SD image and take experiments on that.

Hi @liangfu, how does the VTALoadBuffer2D debug instrumentation work?

As I look at the code it seems the effect of VTALoadBuffer2D at this point is to push an instruction in the instruction queue and nothing is really executed until the device is given the go with the instruction queue address and the number of instructions to fetch.

So reading memory here just reads whatever was left by a previous run. Run the same test twice with another different test touching the same region in between and the dumps are different.

1 Like

Ok, this only works in the context of a test with multiple layers when the input to a layer is the output of the previous layer, i.e. the load dram source memory is not taken from a copy from the host.