Visualize Tensor Expression

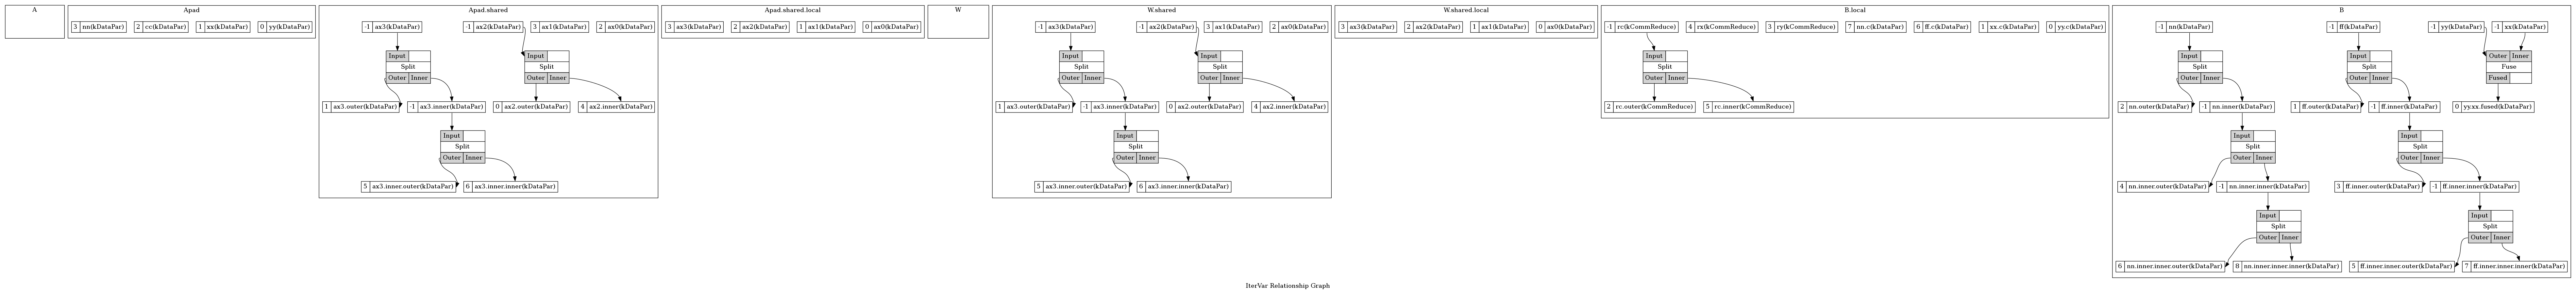
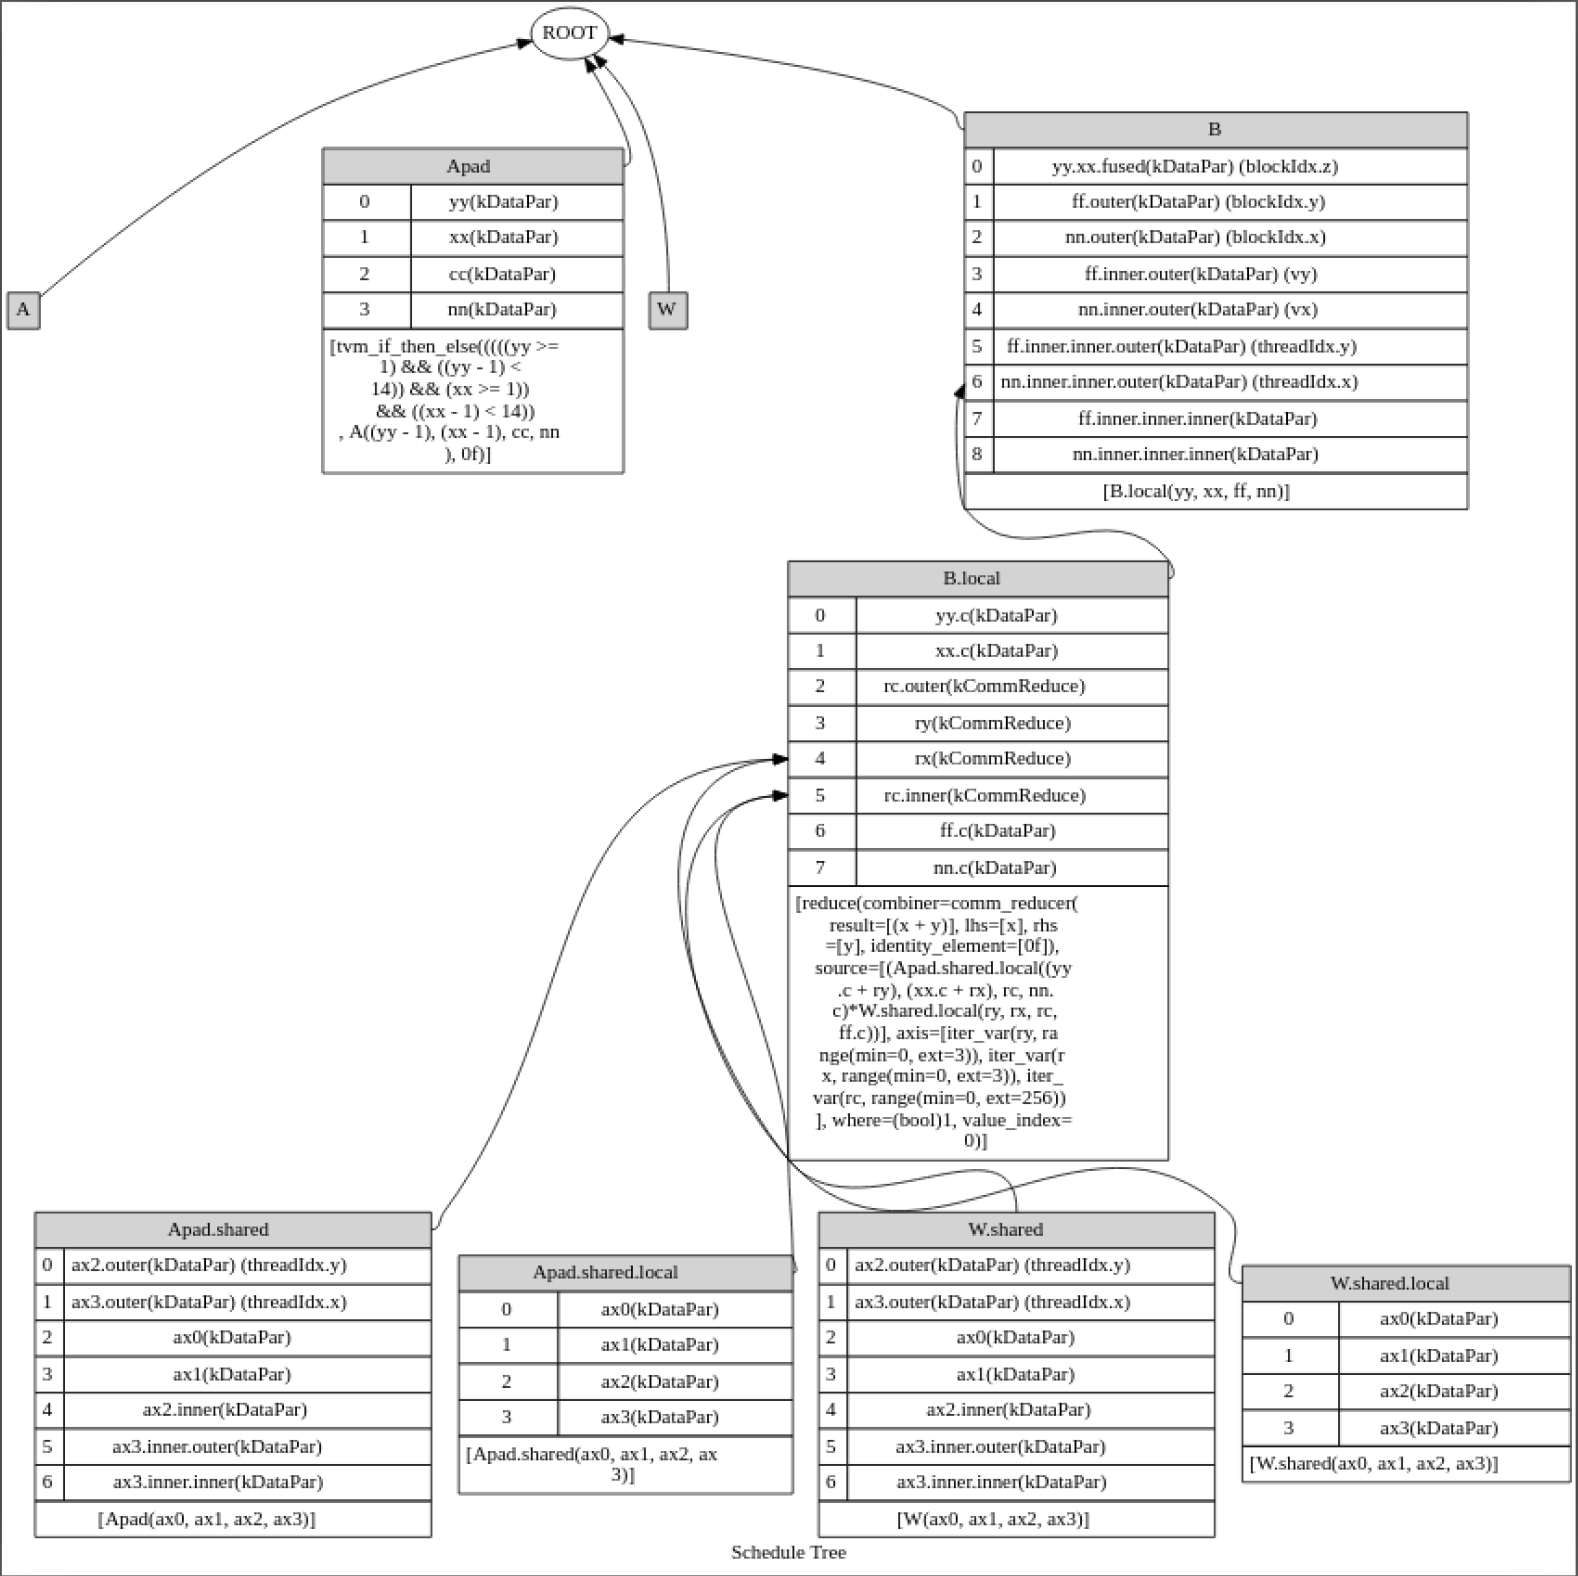
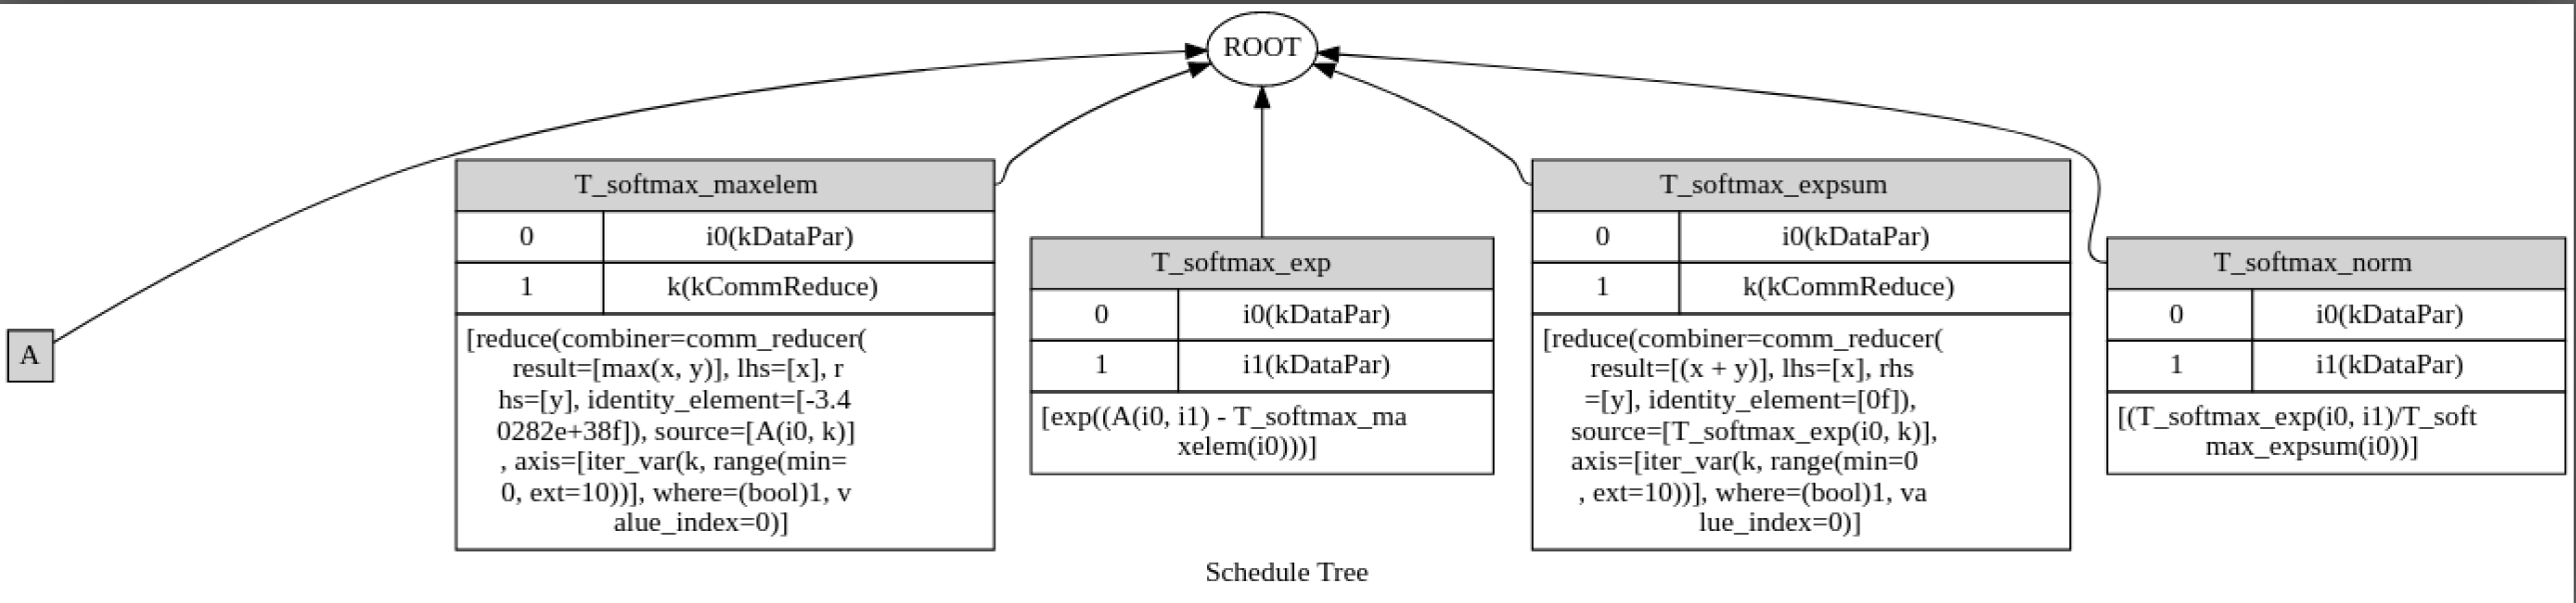
We would like to share a visualization tool (Tensor Expression Debug Display, or TEDD) for displaying scheduling results in Tensor Expression. We use three graphs (Schedule tree, IterVar relationship graph, and dataflow graph) to represent Tensor Expression schedules, as described in the operation model document linked from An operational model of schedule primitives in Tensor Expression.

The tool is written in Python, extracts information from a given schedule with Tensor Expression python APIs, and renders them in Graphviz dot and SV. It depends on these modules: tvm, graphviz, IPython, and html.

We’d like to hear feedback from the community and to make a PR, if it is useful.

The following are some example figures.

The final schedule from tutorial opt_conv_cuda.py:

The final schedule from verify_softmax in topi/tests/python/test_topi_softmax.py:

Some example usages:

import tedd
tedd.viz_dataflow_graph(s, False, '/tmp/dfg.dot')
tedd.viz_schedule_tree(s, False, '/tmp/scheduletree.dot')
tedd.viz_itervar_relationship_graph(s, False, '/tmp/itervar.dot')
8 Likes

Does the tool also help visualize stage groups? The examples given don’t have any nested groups I think.

Not yet. We will make it ask enhancement, probably using subgraph.

Any recommendation about where to put this tool under tvm, such as python/tvm/contrib/tedd.py?

python/tvm/contrib/tedd sounds great

The following is a proposal spec for data source DOM tree for TE visualization. I intend to let visualization tool implementation decide how to render these information. In this tree:

  • The root is a schedule node containing an array of stages.
  • Each stage node, in addition to its properties (only those extracted from TE for visualization), contains arrays of its IterVars, IterVar relations, and input tensor sources (i.e. upstream stages).
  • Each IterVar node and IterVar relation node also have their properties extracted for visualization.
  • Every node has an “id” field with unique ID for referencing, such as that the stage node uses IDs to refer to its upstream stages. It is also useful for graphviz.

The follow figures show examples of each node in JSON:

Would be great to get feedbacks from folks, cc @yzhliu @haichen @ajtulloch @masahi @Hzfengsy

One thing to note: should we directly use index (in an array)instead of the hash id?

We use indices for nodes to access their child nodes, such as one stage accessing its itervars. Hash IDs are used for one node to refer nodes in another subtree in the DOM tree, such as one stage compute_at an itervar in another stage.
Yes, an alternative implementation is to change Hash IDs to a readable path (composed w/ some indices, e.g. stage index + itervar index or stage index + tensor index) to the target node in the DOM tree.

Could you also show the range of each iter var in the table?

ps. I wonder whether the new unified IR will require the visualization tool to change a lot?

Good point about the range information! I have added them. We showed this tool during the last TVM conference. @tqchen told us about the new unified IR and suggested us to move forward w/ the existing IR.

Is there any plan for visualization too for the new TE IR? We may be able to help to upgrade TEDD or create a one for the new IR.

Updated PR to address the comments:

  1. Separate data extraction (DOM) and visualization 1.1. Add a new API tedd.dump_json(schedule) to return a JSON string for the visualization data extracted from the given schedule 1.2. Render DOT from the extracted JSON 1.3. Use indices to refer nodes in the DOM tree
  2. Add a tutorial showing the TEDD usage
  3. Add range information to IterVars in the graphs

Updated DOM spec:

  • The root is a schedule node containing an array of stages.
  • Each stage node, in addition to its properties (only those extracted from TE for visualization), contains arrays of its IterVars, IterVar relations, output tensors, and references to input tensors.
  • Each IterVar node, IterVar relation node, and Tensor node also have their properties extracted for visualization.
  • Refer nodes in another subtree with DOM path composed of array of indices. For example, IterVar w/ DOM path [2, 4] is the 4th IterVar in the 2nd stage (both indices are zero based).

dom_schedule_json

Can @tqchen or someone review the PR (https://github.com/apache/incubator-tvm/pull/4651)? It’s been clean for merge for more than two weeks.

Thank @tqchen for reviewing and approving the PR. The tutorial is online: https://docs.tvm.ai/tutorials/language/tedd.html.

However, the three static images are missing. I have attached the images in the PR (https://github.com/apache/incubator-tvm/pull/4651#issuecomment-584702130). Can someone upload them to dmlc/web-data for me? If there is a more convenient location to host them, please let me know.

please feel free to send a PR to the web-data. Also we have another community driven place to hold webdata for tvm in https://github.com/tvmai/web-data